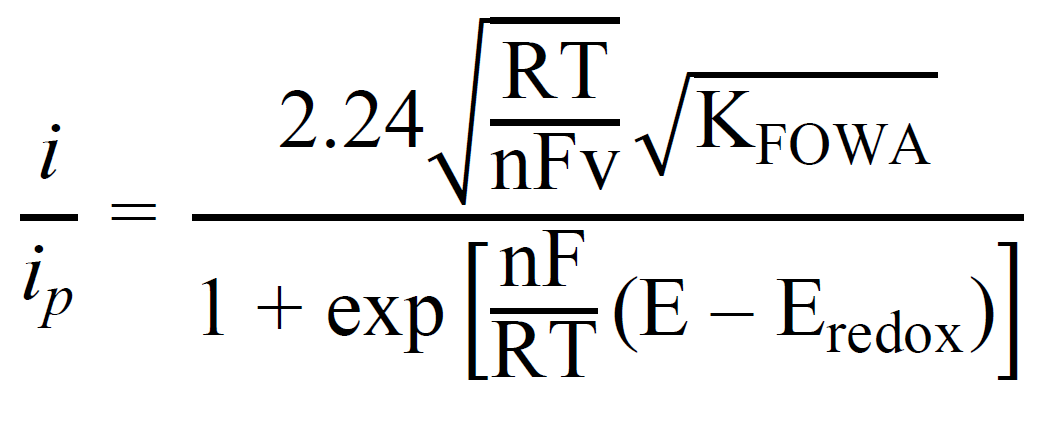
1. The user should input the Eredox value in the tab - Input Eredox
2. The user should input the iredox value in the tab - Input iredox
3. Choose the CSV file from your computer containing i and E values to perform the analysis
4. Click “Upload and Compute” and then the corresponding graph will generate
5. Select the points for linear fitting and click “Compute Slope and R square”. The users can select different regions for linear fitting and decide whether to accept or reject the computed slope and R square. Click “Reset” and select a different part for linear fitting
6. The users can then use this slope value to calculate the TOFmax. Input this slope in the tab “Slope for linear fitting”
7. Input the number of electrons used in the process “n” and the scan rate in V/s
8. Click “Calculate Result”. This will generate the TOFmax value based on the equation displayed
1. Input the TOFmax value which you obtained from the last tab of the website
2. Input thermodynamic standard potential E°A/B and the potential where catalytic current is at half maximum Ecat/2
3. Click “Generate Tafel Graph”. This will then display the Tafel graph corresponding to the equation displayed for TOF
4. The users can then fetch entries from the database of published papers with TOFmax reported and compare their catalytic system. To do this, from the combinations provided, users can select the metal center, solvent, ligand etc., and hit “Fetch Entries”
5. Click “Reset” and this will remove all the fetched entries. Repeat Step 4 to show the reported Tafel plots with different set of combination
FOWA Graph
Slope for given points is :
R Square for given points is :
y-intercept for given points is :


